In a recent survey conducted by the Post, respondents were asked: “In the current situation, which political party do you consider the most trustworthy?” According to the weighted results, 45.7 percent of respondents named one political party or another. However, a total of 54.3 percent responded with “none,” “don’t know,” or “prefer not to say.”
Within this 54.3 percent who did not name a party, there is an important distinction between “rejection” (“none”) and “uncertainty” (“don’t know”). Because these represent different attitudes, this figure cannot simply be treated as a generic “no response”.
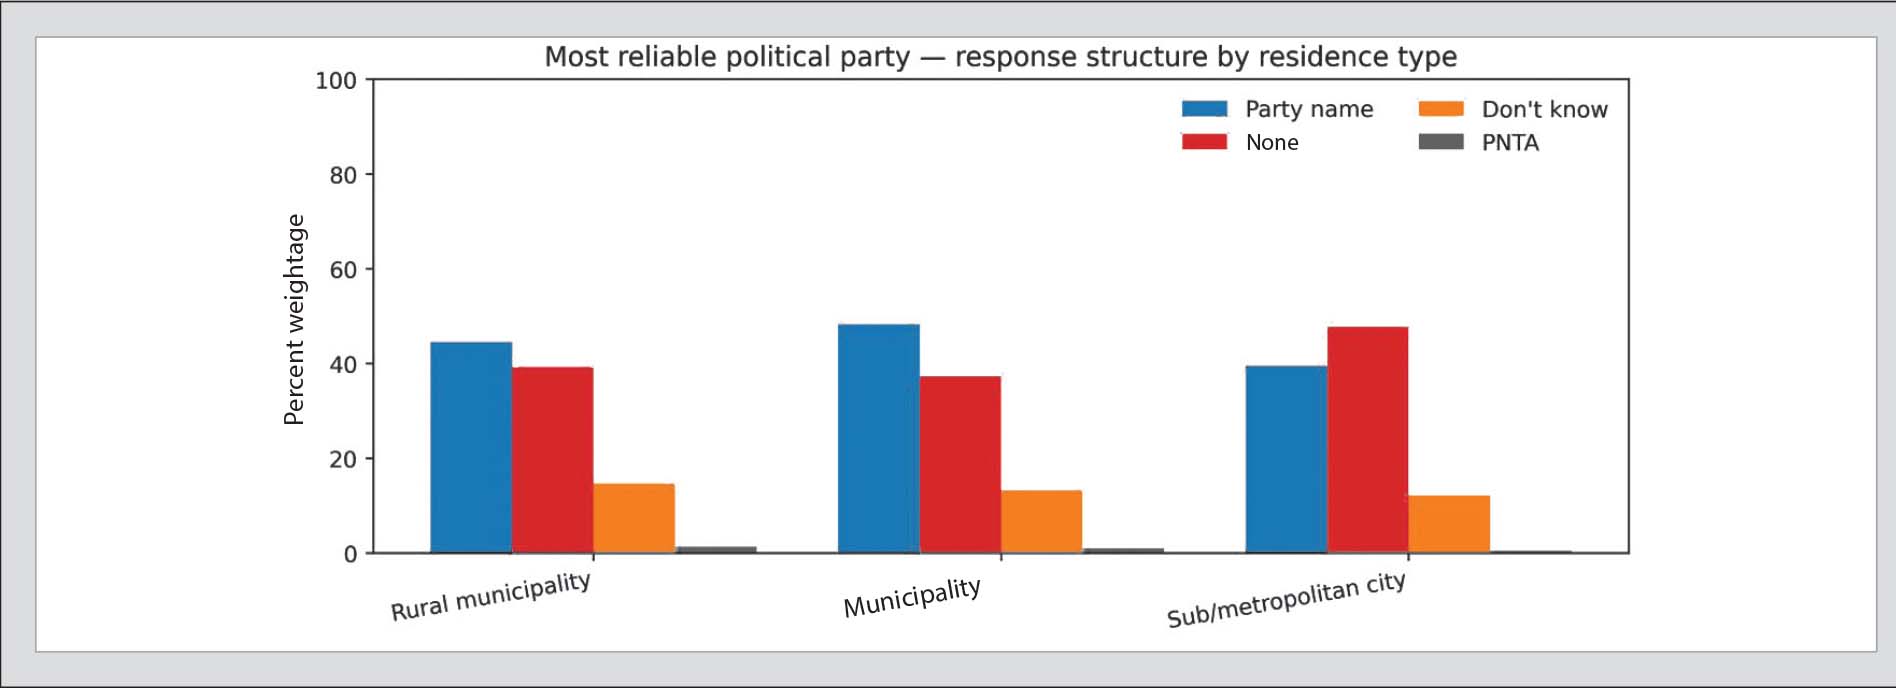
Based on the weighted percentages, 39.6 percent of all respondents said “there is no trustworthy political party.” Another 13.6 percent said “don’t know,” and 1.1 percent said “prefer not to answer”. Thus, among those who did not name a party, the larger share is concentrated in “none” rather than “don’t know”. This suggests that, for many respondents, no party qualifies as “trustworthy”. At the same time, the 13 percent who said “don’t know” is also not insignificant.
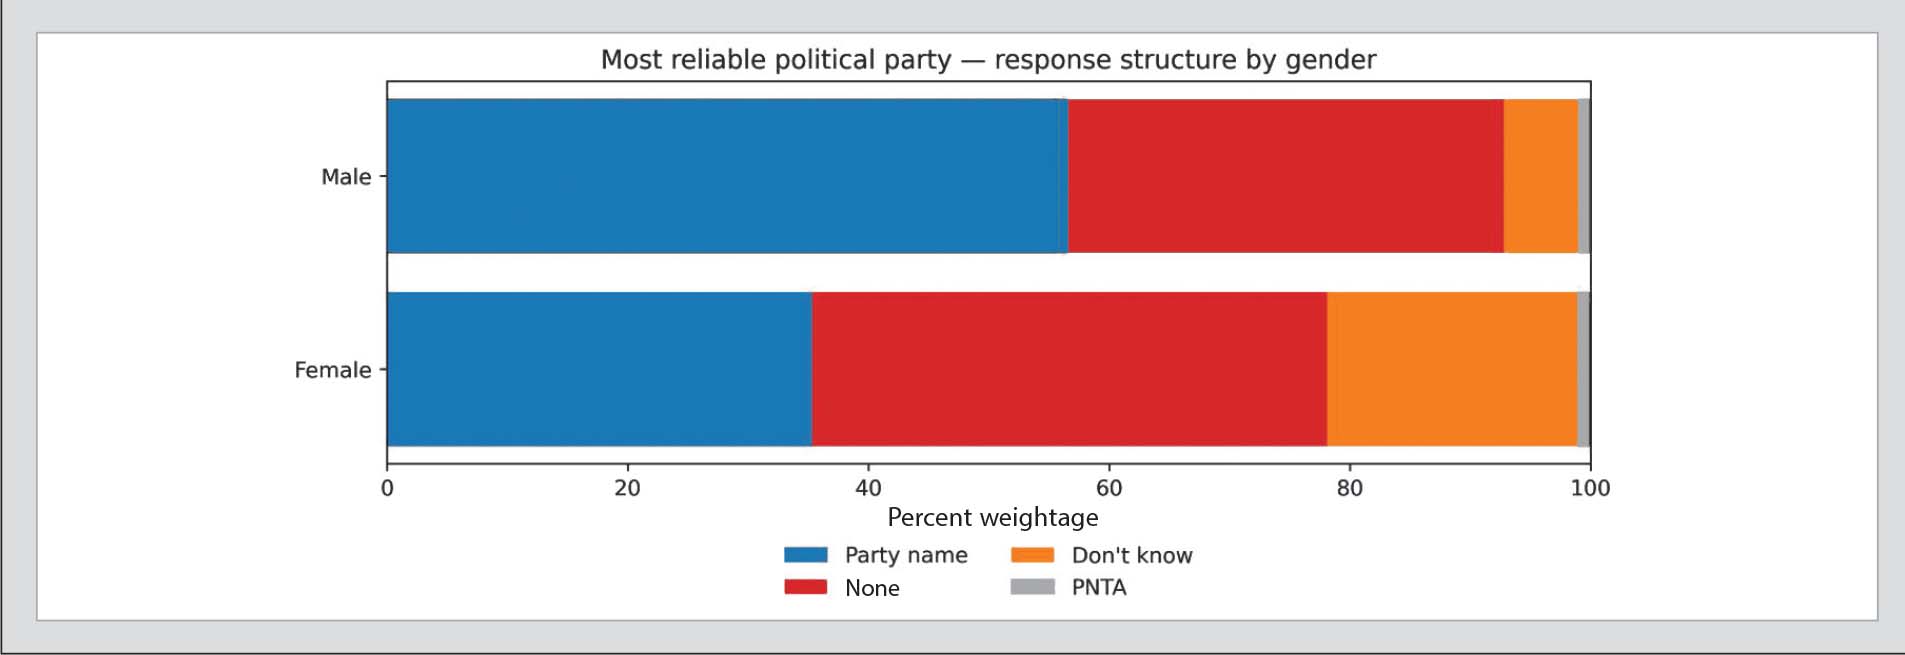
Demographically, these responses are not evenly distributed. The clearest difference appears along gender lines. Among women, 20.8 percent said “don’t know”, compared to just 6.2 percent of men. Similarly, 42.8 percent of women said “none”, higher than the 36.2 percent of men. This combination indicates comparatively higher levels of both uncertainty and rejection among women regarding a “trustworthy party”, shedding light on patterns of political engagement and confidence.
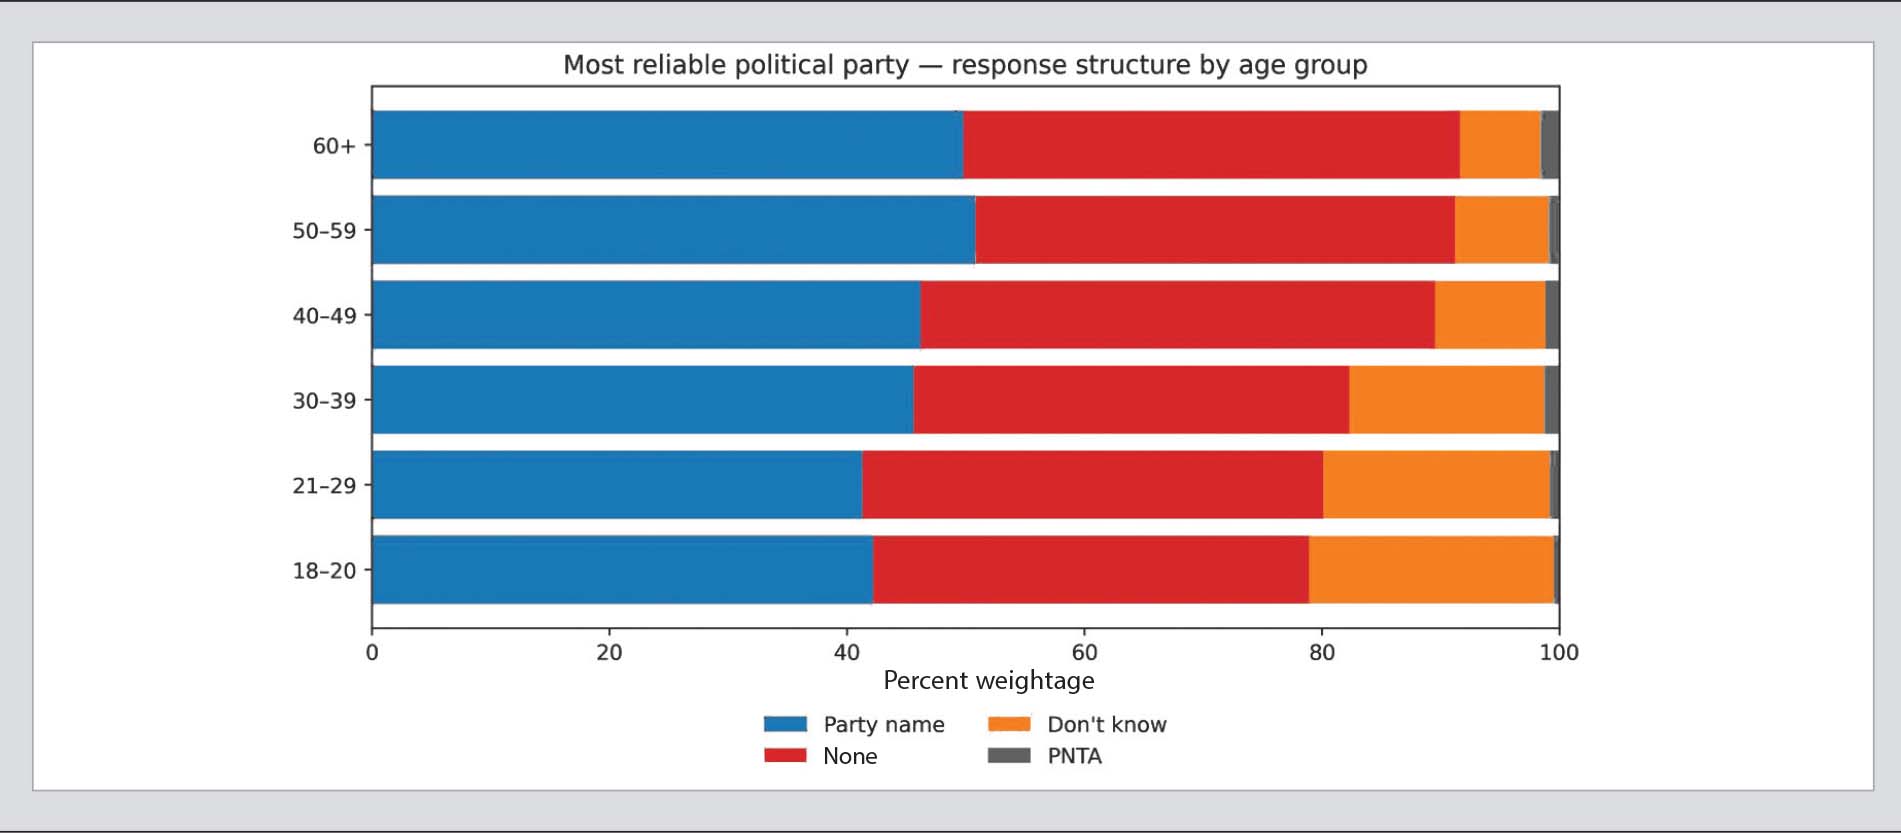
By age, the pattern of “don’t know” is also clear. In the 18–20 age group, 20.6 percent responded “don’t know”, and in the 21–29 group, the figure was 19.1 percent. By contrast, among those aged 60 and above, only 6.8 percent said “don’t know”. This suggests that younger respondents are more inclined not to assert or commit to a choice when asked about a trustworthy party. The share of “don’t know” responses declines as age increases.
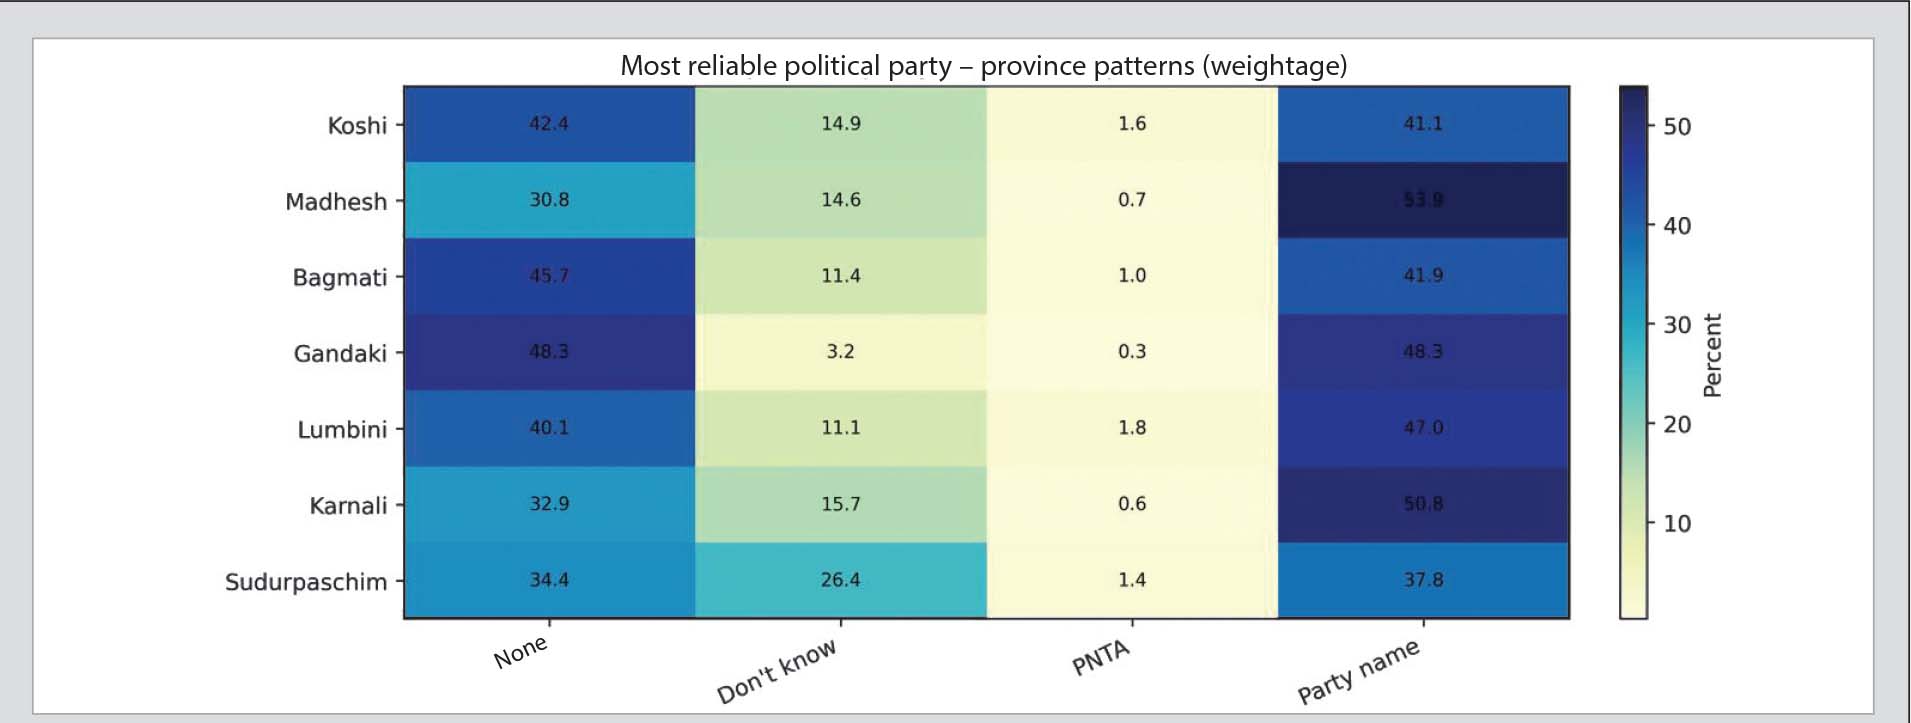
Provincially, the highest proportion of “don’t know” responses is found in Sudurpaschim (26.4 percent). In contrast, in Gandaki Province, only 3.2 percent said “don’t know”. However, in Gandaki, 48.3 percent said “none”. In Madhesh, the proportion saying “none” is 30.8 percent, lower than in other provinces. These differences show that “none” and “don’t know” cannot be lumped together as a single category of “not choosing a party”.
A similar pattern appears by place of residence. In sub-metropolitan cities and metropolitan cities, 47.8 percent said “none”, compared to 39.3 percent in rural municipalities. This indicates a stronger rejection response in urban contexts regarding trustworthiness.
Because “don’t know”, “none”, and “prefer not to say” carry different practical meanings, the combined 54.3 percent who selected these responses cannot simply be described as “disillusioned with parties” in a single phrase.
“Don’t know” may reflect indecision, uncertainty, or difficulty in answering immediately. “None” more directly signals a lack of primary trust in any party. For example, the higher share of “don’t know” in Sudurpaschim and the higher share of “none” in Gandaki represent two distinct patterns that should not be interpreted in the same way.
Overall, the key message from this question operates on two levels. First, the fact that a larger share of respondents did not name a party than those who did is itself a significant signal. Second, within the non-naming responses, “none” and “don’t know” are distributed differently across gender, age, province, and residence.
Therefore, rather than limiting the debate on trust to which party was named by whom, it is equally important to examine how many citizens were unable or unwilling to express trust in any party—and how that pattern is distributed. This opens up an important dimension of current public sentiment.
Disclaimer (mandatory): The fieldwork for this survey was conducted approximately one month prior to the present moment. Therefore, these weighted percentages should be understood as reflecting public sentiment at the time of data collection. The findings presented here are not intended to promote or oppose any political party, nor to predict electoral outcomes; they aim solely to illustrate the structure of citizen responses to the question of “trustworthiness”.
 20.13°C Kathmandu