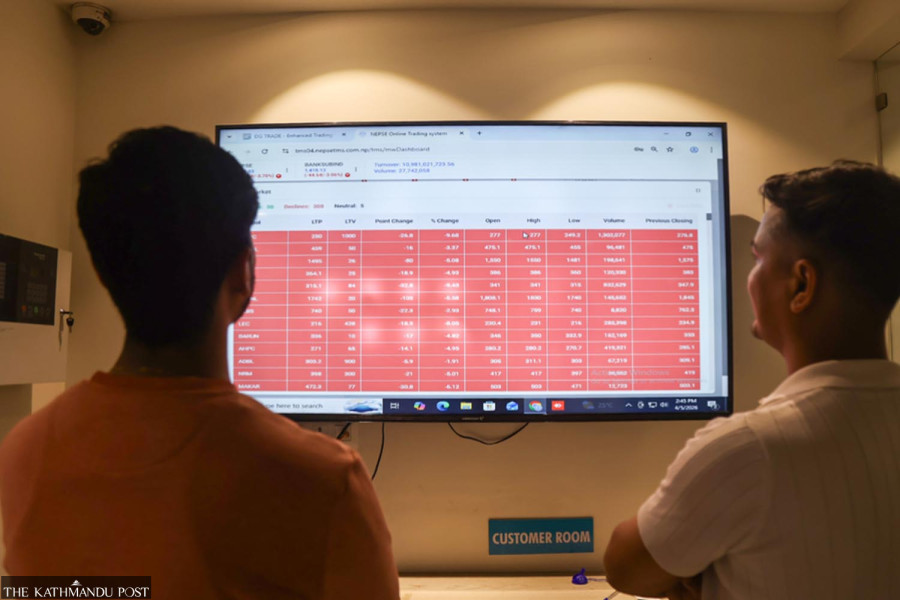
Rumours of a possible arrest of a top politician, business figures in custody, and the Tihar festive season rattled investors, but technical indicators suggest the market is regaining some stability. Past arrests before public holidays added to investors’ anxiety ahead of Tihar festival. Post file photo
Share investors were anxious on Thursday morning about how the market would perform amid speculation that a senior political leader could be arrested.
Investor and analyst Ajit Khanal took to Facebook to flag Thursday’s trading as particularly sensitive, saying the market could be more volatile than usual and needed close attention.
His concern stemmed from an issue that might appear unrelated to the stock market: rumours circulating since early morning that a top politician could be arrested.
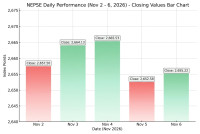
The market reflected similar anxiety, falling by as much as 25 points during trading. However, it recovered some ground before the 4 pm close, limiting its loss to 12 points.
This is not the first time political developments and arrests have unsettled Nepal’s share market. Such reactions have occurred repeatedly since the Rastriya Swatantra Party assumed power.
Controversial businessman Deepak Bhatta was arrested on April 2. The market reopened on April 8 after a public holiday and the Nepal Stock Exchange (Nepse) index plunged 105 points in a single session.
About a month and a half later, on May 12, Jyoti Prakash Pandey, chief executive officer of Nepal Investment Mega Bank, was arrested. The market fell by 39 points that day.
The pattern has continued, with the market reacting to businesspeople being arrested and major political developments.
Investor and analyst Subash Chandra Dhungana said the market was sensitive to such incidents because investors preferred a stable environment.
“The stock market always seeks peace. But when businesspeople or political figures are arrested, or there is a possibility of their arrest, the market reacts in some way,” Dhungana said.
He said investors were also concerned because arrests had often taken place shortly before public holidays in the past, raising fears that a similar incident could occur again ahead of the Tihar holidays.
However, Tara Prasad Phulel, president of the Share Investors Association, said political developments were not the only factor affecting the market.
“Political developments have had an impact on the market. At the same time, investors are preparing for the festive season, and the market will remain closed for about a week. Nepse has yet to establish a clear trend,” he said.
The festive season was also reflected in Friday’s trading, when turnover fell to its lowest level since October 26. Shares worth Rs3.46 billion were traded.
Market remains above its average
The share market is currently trading above its average level.
The Nepse index is above the middle line of the Bollinger Bands, a technical indicator developed by John Bollinger in the 1980s. The indicator tracks market movements within an upper and lower band.
When the market approaches the upper band, it indicates relatively strong buying pressure. Near the lower band, it suggests stronger selling pressure.
The indicator also measures market volatility. The bands had widened when volatility was high in recent weeks, but their movement now suggests that fluctuations have eased somewhat.
When the upper and lower bands move closer together, volatility is generally lower. Wider bands indicate greater market fluctuations.
Buying and selling remain balanced
The Relative Strength Index (RSI) suggests that the market’s average gains are currently greater than its average losses.
The RSI measures market momentum by comparing the pace of price increases with that of declines. American technical analyst J Welles Wilder developed the calculation method in 1978.
The indicator generally uses changes in the market index over the previous 14 trading sessions. It calculates the average gains on days when the market rises and the average losses on days when it falls.
The RSI ranges from zero to 100.
A reading below 30 is generally considered to indicate strong selling pressure, while a reading above 70 suggests strong buying pressure. Between 30 and 70, buying and selling are generally considered more balanced.
The RSI stood at 55.82 on Friday. It had risen from 50 to as high as 58 before easing after Thursday’s market decline.
Buying outweighs selling
The accumulation and distribution (A/D) indicator also suggests that buying activity exceeded selling on Friday.
Accumulation indicates that investors are building positions, while distribution signals increased selling.
The distribution reading stood at 1 million on Friday, indicating that buying pressure was stronger that day. On Thursday, the indicator had shown a distribution reading of 1.8 million.
The accumulation and distribution figures do not represent the actual amount of money entering or leaving the market. Rather, they provide an indication of whether buying or selling pressure is prevailing.




 11.63°C Kathmandu