Opinion
The truth about federal states
Province 3 would fare the best while Province 4, 6 and 7 might not be economically viable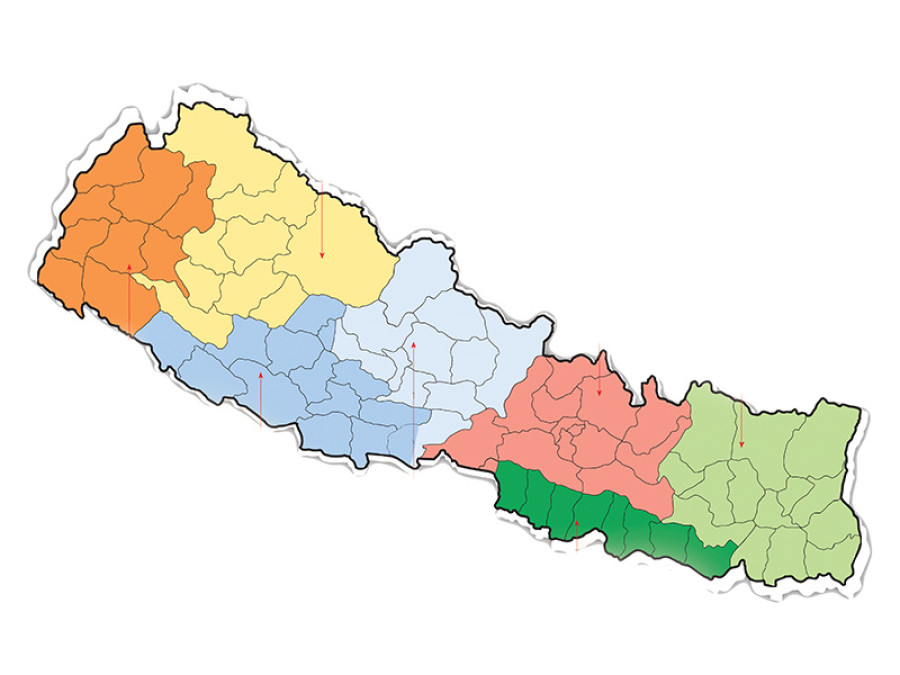
Khim Lal Devkota
Yesterday, the Constituent Assembly of Nepal promulgated Nepal’s Constitution 2015, which was endorsed by an overwhelming majority last Wednesday. Out of the total 598 lawmakers, 507 (85 percent) lawmakers voted in favour of the constitution. All the articles, the preamble and the name of the constitution were also endorsed in the same meeting. The country has, thus, been effectively federated into seven states with three tiers of governments; federal, provincial and local. Though Madhes-based parties have opposed the constitution, the three major parties have assured the people that they are open to amending it. Most Nepalis seems to be quite happy with this latest development as they hope that the statute will pave way for political stability.
This article briefly highlights the key demographic and economic components of the seven provinces: population, geographical area, Human Development Index (HDI), availability of drinking water, per capita income, agriculture production, roads and revenues. To do so, the population, area and other related data on Nawalparasi and Rukum districts have been divided into 50-50 in the provinces they fall in.
Population, HDI and income
Province 3 has the highest population (20. 87 percent) followed by Province 2 (20.40 percent) and Province 1 (17.12 percent) respectively. Provinces 6 and 7 are the least populated states with only 4.82 and 9.63 percent of the total populatin of the country. The population of Province 3 is 4.33 times higher than that of Province 6 while the population of Province 2 and 3 is almost equal.
With regards to HDI, Province 6 has the lowest index followed by Province 7 and 2 respectively. Province 3 and 4 have the highest HDIs. Out of ten districts with the lowest levels of HDI in Nepal, four lie in Province 6 while three lie in Province 7 and Province 2 respectively. The ten districts are: Bajura, Bajhang, Kalikot, Humla, Achham, Rautahat, Mahottari, Jajarkot, Rolpa and Mugu. Similarly, Province 7 has the lowest level of income, below Province 6 and 5, while Province 3 and 4 have the highest levels of income.
Water, agriculture and roads
The table shows that Province 6 has the lowest availability safe drinking water followed by Province 7 and 3 respectively. In Province 2, 92 percent of the people have access to safe drinking water. The data related to HDI, per capita income and drinking water have been derived from the Nepal Human Development Report 2014.
With regards to agriculture, paddy contributes 21 percent to the total agricultural production of the country. Other cereal crops include wheat, barley, millet, etc. Similarly, jute, sugarcane, tobacco, among others, are cash crops. Based on the 2070/71 agricultural statistics received from the Ministry of Agricultural and Cooperative, and by assuming 50 percent weighted for cereal crops, 20 percent for cash crops, 15 percent for livestock production and 15 percent for other crops, the agricultural indices of the seven provinces are presented in the table. Province 3 followed by Province 2 and 5 respectively has the highest agricultural indices. Province 6 followed by Province 7 has the lowest indices in this category.
Concerning roads, Province 3 (19.05 percent) followed by Province 1 (17.99 percent) has the largest share of central roads while Province 6 and 2 have the lowest. Province 3 and 4 have the highest share of local roads. Province 6 has the lowest concentration of both central and local roads. The data for central roads was obtained from the Department of Roads and while information on local roads was acquired from the Department of Local Infrastructure Development and Agriculture Roads.
Revenue
In terms of revenue collection, the provinces are the modified and extended versions of the curent District Development Committees (DDCs). In the Fiscal Year 2070/71, the DDCs generated Rs 1.85 billion in internal revenues, mostly from sales tax and source utilisation tax. The terrain DDCs revenues come from selling sand and stones. Out of total tax collected in FY 2070/71 the highest portion, ie, 29.14 percent came from Province 3 while Province 6 and 7 contributed the least.
In addition, the government currently shares five types of revenue with the DDCs. In FY 2070/71 DDCs received Rs 1.66 billion from the government. The headings of revenue sharing are: land registration fees, mining, forest, hydropower and mountaineering. As per the new constitution, land registration fees will be shared with the provinces and local governments (Village Municipality and Urban Municipality). However, the rest of the revenue will be shared with all the three governments (central, provincial and local). The revenue sharing data shows that Province 1 has received the highest revenue share followed by Province 3 and 4 while Province 6 and Province 7 have received the lowest share respectively. In FY 2070/71, the government collected Rs 356 billion revenue from different headings such as customs duty, value added tax, corporate income tax, personal income tax etc. Data show, Province 3 contributes a lion’s share to the overall central revenue collection, ie, 48.76 percent followed by Province 2 and 5 respectively whereas the share of Province 6 is less than one percent.
Not at all similar
All in all, Province 3 ranks the highest in almost all the variables including agriculture production. The plains-based Province 2 takes the second position. The reason for this is that the Tarai districts rank high in terms of paddy production. The districts in Province 3 such as Kavrepalchock, Dhading, Chitwan, among others, fare better in terms of agriculture and livestock production.
With regards to central revenue collection figures, Province 3 contributes the highest share followed by Province 2, 5 and 1. Currently more than 80 percent of the revenue headings come under the jurisdiction of the federal (central) government. But Province 4, 6 and 7 would not be economically viable even if the revenue were to go directly to the provinces instead of the central government. In terms of revenue sharing and local taxation, Province 4 seems to be in a relatively better position. In conclusion, even though the seven provinces are assymetrical in nature, Province 6 and 7 consistenly rank the lowest in all the variables.
Devkota holds PhD in fiscal decentralisation


 10.12°C Kathmandu




%20(1).jpg&w=300&height=200)

