 24.72°C Kathmandu
Wed, Jul 22, 2026
Opinion
More or less equal?
By sounding the alarm on inequality, Oxfam recently did in Nepal what it has been doing so effectively on the global stage for a few years now.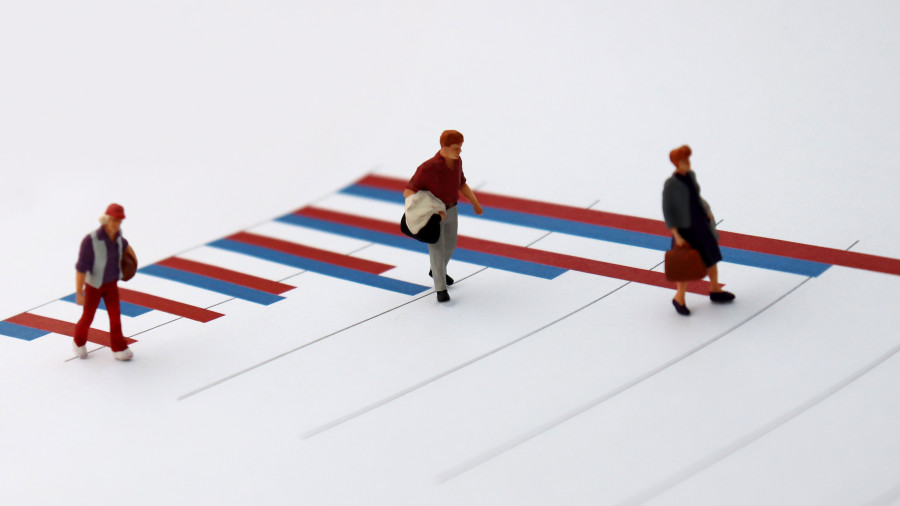
bookmark
Sailesh Tiwari
Published at : March 18, 2019
Updated at : March 18, 2019 08:02
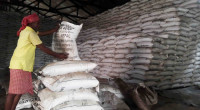
By sounding the alarm on inequality, Oxfam recently did in Nepal what it has been doing so effectively on the global stage for a few years now. Pause and let these nuggets from Oxfam’s new report, “Fighting Inequality in Nepal: The Road to Prosperity”, sink in. Income of the richest 10 percent is three times that of the combined income of poorest 40 percent. Top bank executives earn more than 100 times the salary of an average worker. The top 10 percent of the population commands more than 26 times the total wealth of the bottom 40. The wealth gain experienced by the richest person alone would be enough to cover the entire social protection budget of the Government of Nepal.
The report leaves ample room for improvements on methodology and the overall quality of the analysis. But advocacy organizations can be granted the liberties they have to take to draw attention on important issues. What is important is to make sure that theirs is not the last word on the subject and therein lies the rub that often receives very little attention. Serious policymakers looking to go beyond the social media chatter and do something about inequality today will have to base their decisions on information that is almost a decade old. Yes, the brand-new report on inequality you read (or heard about) is based heavily on data that was collected in 2010.
Mind the (data) gap
The observation sounds wonkish. Why does it matter? Conventional measures of inequality are derived from information on income and consumption collected from a randomly selected group of households designed to be representative of the entire population. Among other things, each of these households is asked detailed questions about the quantity and quality of food they consume, the kind of houses they live in, the amounts they spend on their fuel and energy needs, on health, education, transportation, on durable assets such as pressure cookers, furniture and televisions etc. etc. On the income side, these surveys ask about the economic activity of each member of the household, the jobs they do if they are not in school or unemployed and the amounts they earn in wages, salaries or profits if they have small businesses.
When all this information is aggregated, it yields what economists call the income distribution; a ranking of all households in a country based on their income. Official measures of poverty, vulnerability, inequality etc. come out of this data. This is also the kind of data you would need if you wanted to investigate crucial policy relevant questions. Who are the poor and vulnerable? Where do they live? What are their characteristics that keep them in poverty? What kind of households are moving up the economic ladder and who is being left behind? Who benefits from the government’s social programs such as free education, employment guarantees and subsidies? Who is excluded? Who pays taxes and how does the burden of various taxes fall on different parts of the income distribution?
The Nepal Living Standards Survey conducted by the Central Bureau of Statistics has been the flagship survey that has collected this kind of information in Nepal. While this survey used to be implemented once every six to seven years in the past, it has been almost a decade since the last time it was conducted in 2010. A similar survey of the overall labor force has also not been fielded in over a decade now. Countries such as Thailand and Indonesia run surveys of this kind every year. Bangladesh, Pakistan and Sri Lanka do them once every two years. India does them roughly in three-year intervals.
Whose prosperity?
By all accounts, Nepal has embarked on an unprecedented march towards prosperity. What this prosperity means or whose prosperity we are talking about, however, appears to have fuzzier interpretations. The rate of growth of per capita GDP is a fine starting point. Together with what happens to the GDP, the liquidity crunch in the banking system, gyrations of the stock market, widening trade deficit, dwindling reserves, creeping inflation are all important indicators of various aspects of the health of an economy.
But the health of the economy is often not an end in itself; it is a means toward lifting the living standards of the population. How the health of the overall economy translates into actual improvements in the living standards of the population—especially those in the bottom parts of the income distribution—is what the fundamental metric of prosperity should be.
High growth can be achieved in ways that benefit those at the very top, leaving a large majority of the population unaffected or worse off. Or it can be achieved in ways in which the benefits are more broadly shared. Policymakers have levers at their disposal to determine these choices. Without periodic and timely data to monitor and track the well-being of the people through instruments such as the Nepal Living Standards Survey, debates and decisions about prosperity have been sorely bereft of what should be their fundamental essence.
The urgency of tackling the country’s complex development challenges has prompted some commentators to call for an ‘economic war room’. This is a good idea. But for such a war room to be effective, it will have to be powered heavily and reliably by a rejuvenated statistical system that can generate key data and information and funnel those into the policymaking process. The Central Bureau of Statistics, the government’s primary data collection and management agency, should be strengthened, empowered, and funded to lead that charge. At a minimum, censuses and crucial surveys—such as the living standards survey and the labor force survey—should be conducted periodically and in a timely manner, not at the behest of donors to meet reporting obligations on international commitments such as SDGs nor to generate content for sterile plan documents. They should be conducted specifically and expressly for the purposes of monitoring the economic and social health of the population, with the objective of fine-tuning policies based on lessons learnt on what works and what doesn’t.
Like cholesterol in human body, inequality is a drag on the economy. High inequality polarises societies and stunts economic growth. When perceived to be unfair, it can also stir up social unrest and increase the risk of conflict. The Occupy movements in the United States, the Arab Spring revolutions that swept the Middle East and North Africa region and the ongoing gilets jaunes protests in France are some manifestations. Nepal’s own decade long Maoist conflict had its genesis—at least partially—in the deep structural inequalities compounded over generations.
The nature, size and evolution of inequality should thus be central to Nepal’s policy discourse on prosperity. But as the Oxfam report highlights, the information base on which this conversation can be had at the moment is woefully outdated.
Tiwari tweets at @_SaileshTiwari.
.png&w=200&height=120)

Editor's Picks
Proposed ‘Romeo and Juliet’ law may spare boys, but what about girls?

Three prime ministers, 10 premierships. Why is Sudurpaschim still Nepal’s poorest province?

Inside the strange, disciplined, unreachable world of Nepal’s Prime Minister

Three credit booms in three decades ended in economic downturn

How Nepal could lose a generation of footballers due to FIFA’s suspension
E-PAPER | July 22, 2026
×