Columns
Wealth distribution among provinces
The wealth distribution data from the 2021 census provides essential insights for targeted policy interventions.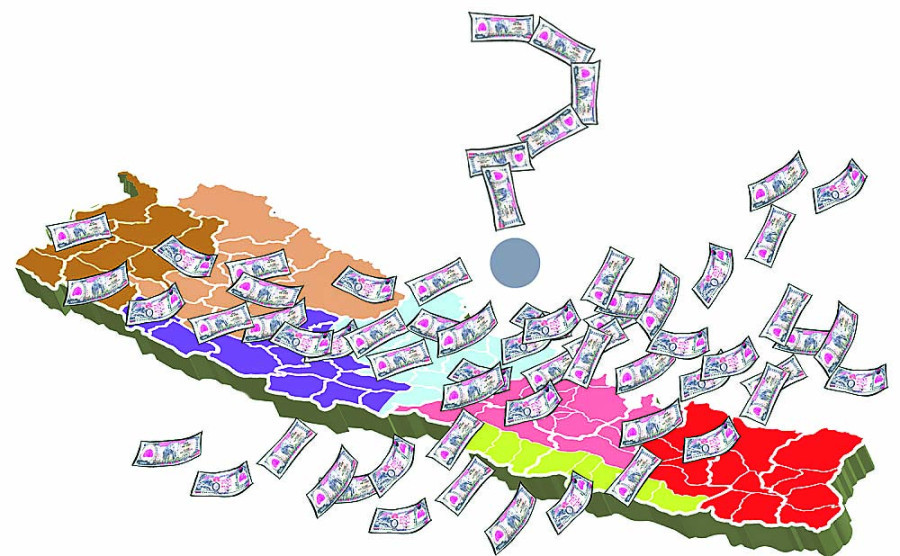
Hem Raj Regmi
Nepal boasts a history of 110 years of undertaking decennial population censuses, starting from 1911. The recent Nepal Population and Housing Census (NPHC), conducted from November 11 to 25, 2021, is the 12th in this series. The initial four censuses, conducted before 1950, are not considered scientific.
However, the censuses conducted after 1952-54 have been meticulously designed to generate valuable statistics and indicators. These indicators assess the situation of various special population groups, including women, children, youth, the elderly, persons with disabilities and migrants, as well as changes over time. The 2021 census holds particular significance as it was conducted after the nation incorporated a federal government. This transition marked a new era in Nepal’s administrative and political landscape. Additionally, the 2021 census was completed after numerous setbacks and reorganisations brought on by the Covid-19 pandemic. Initially scheduled for June 8 to 22, 2021, the dates were postponed to November 11 to 25, 2021 due to pandemic-induced disruptions.
Wealth index
An index is a statistical technique used to combine various indicators into a single numerical score, simplifying complex data into an easily interpretable format. Composite scores are commonly used to monitor and evaluate the performance of different issues. In this context, the performance of the census findings is assessed using the wealth index. The "wealth index" was calculated using household characteristics, service utilities and amenities data from the NPHC 2021. This method is widely recognised for constructing such indices.
The wealth index is based on 17 factors, including nine household assets, four services and four dwelling quality variables. These factors are the materials used in the foundation of the house, outer wall, roof, floor, the main source of drinking water, usual fuel for cooking and lighting and toilet facility, availability and type of toilet facility. The nine household assets include television, landline phone, smartphone, computer/laptop, internet, car/jeep/van, motorcycle/scooter, refrigerator and washing machine. These indices were estimated and presented in the given table:
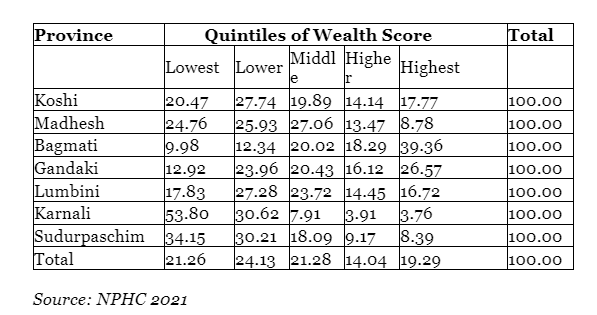
The wealth distribution data reveals significant disparities across Nepal's provinces. More than half of the households in Karnali (51.3 percent) were in the poorest quintile, while only 4 percent were in the wealthiest. Similarly, one-third (33.9 percent) of households from Sudurpashchim were in the poorest quintile, compared to eight percent in the richest. In contrast, two-fifths (38 percent) of households in Bagmati were in the richest quintile, highlighting a stark contrast with provinces like Madhesh, where only nine percent of households were in the richest category.
Implications for policy and planning
The wealth distribution data from the 2021 census provides essential insights for targeted policy interventions. The pronounced economic disparities necessitate a multifaceted approach to fostering equitable development across Nepal. Infrastructure development necessitates investing in basic infrastructure such as roads, electricity and water supply in poorer regions, which can significantly improve living standards and economic opportunities.
Education and healthcare seek enhanced access to quality education; healthcare is crucial for long-term socioeconomic upliftment. These services are foundational for human capital development, which in turn drives economic growth. Economic policies require implementing policies aimed at boosting local economies, such as promoting small and medium enterprises (SMEs) and improving market access for local products, which can stimulate economic activity and job creation.
Leveraging strengths
Wealthier provinces like Bagmati serve as models for successful economic strategies that can be adapted and implemented in less developed regions. To prevent further widening of regional disparities, it is essential to ensure that the benefits of wealth in these provinces are equally distributed. A balanced approach that addresses the needs of poorer regions while leveraging the strengths of wealthier areas can promote more inclusive and sustainable growth across Nepal. Likewise, continuous monitoring and evaluation of socioeconomic indicators are vital to assess the effectiveness of interventions and make necessary adjustments.
The wealth distribution analysis from the 2021 NPHC underscores the critical need for strategic and equitable economic policies in Nepal. We can reduce regional disparities and foster inclusive growth only by focusing on targeted interventions for the most impoverished regions and ensuring a balanced national development strategy.


 6.12°C Kathmandu