Columns
How are different social groups faring?
There is a need for disaggregated data by social groups to understand it.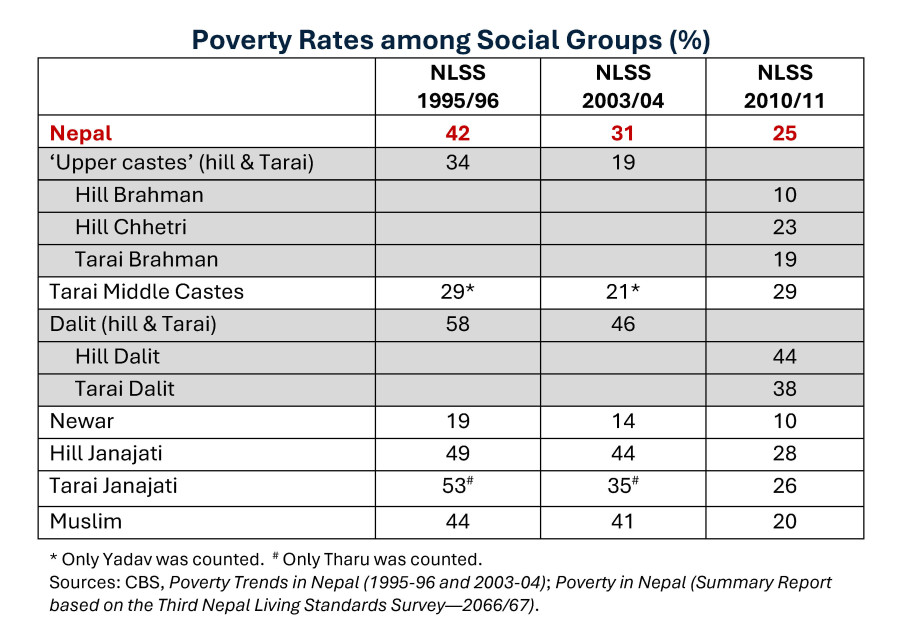
Deepak Thapa
I presume I speak for most non-politically affiliated Nepalis that after the initial shock of being caught off-guard by the ongoing developments at the highest levels of government was over, we could not care less about how it all ended. For the fact remains that everyone would be hard pressed to point out how any of the myriad of governments in the past three decades-plus has made life easier for its citizenry at large. Perhaps the one exception one can allow would be the first CPN-UML government when it introduced direct cash transfers to local governments and the old-age population. Otherwise, despite all the country has gone through—the insurgency and the peace process, the difficult transition, and the new constitution—there has really been nothing to distinguish one government from another. Apart from, one would have to admit, KP Oli’s all-powerful prime ministership in his second stint, marked mostly by his increasingly erratic behaviour and, fortunately for the country, the court-stymied power grab.
Hence, after a collective yawn over the fate of this government or any that follows, we can go back to the good news I had dealt with in my previous column, of a large section of the population having moved out of poverty over time. We learnt that the number of the poor has plunged 5 percentage points even after accounting for an overall rise in living standards between the Nepal Living Standards Survey (NLSS) 2010-11 and NLSS 2022-23. We do not yet know what we can attribute this favourable turn of events to, but certainly migration and the attendant remittances would have played a major role—just as they had in the past.
That poverty rates are lower in urban areas (18 percent) compared to rural Nepal (25 percent) cannot be news even if the rural-urban divide is no more than the function of an administrative boundary rather than rooted in ground reality. We also now know how people living in the different provinces have been doing. Which is useful information to have since, by the time of the next NLSS, we will be able to see how each province has been faring and accordingly heap praise or place blame on the governments deemed most responsible. Although, given how provincial politics continues to be directly affected by the shenanigans at the centre, such an exercise is likely to be quite futile as well.
Missing disaggregated data
By the same token, however, we will also soon need to understand how the different social groups have been doing. We have learnt from experience that advancements by one or two groups may be able to pull up statistics in the aggregate, but unless everyone is being carried along, we can be quite sure it will only breed discontent and foment trouble for everyone. Particularly since the current polity is based on the very premise of inclusion for all, starting with the 12-point agreement, the Comprehensive Peace Accord, the Interim Constitution down to the 2015 Constitution. After all, the preamble to the last reiterates the state’s “determination to create an egalitarian society on the basis of the principles of proportional inclusion and participation, to ensure equitable economy, prosperity and social justice”.
What the quest towards an egalitarian society has yielded so far is unknown. The record so far has been somewhat confusing since there has been no consistency in reporting the results of previous rounds (as is clear from the accompanying figure based on government publications). Nonetheless, it is quite clear that not everyone is moving forward at the same pace. The challenge will be to ensure progress is more evenly distributed. But to achieve such a goal, we do need facts and figures, and hopefully, the NLSS IV results disaggregated by social groups will also be soon available.
What has been disconcerting is that in the interval between the third and fourth NLSSs, there was no attempt by the government to dig deeper into this matter. An opportunity had certainly provided itself with the 2018 Multidimensional Poverty Index (MPI) produced by the National Planning Commission (NPC). Instead, it lay content in the fact that the index data had been analysed at the provincial level. That certainly was required, but the NPC mandarins probably forgot that, in principle, at least, the provinces were created only as a means to ensure equitable outcomes for all social groups. Hence, it was quite imperative to create an MPI for all of Nepal’s caste and ethnic groups and measure progress over time.
It is not that MPI cannot be used to recognise differences arising from one’s background. In fact, one of the flagship MPI reports is titled “Unmasking Disparities by Ethnicity, Caste and Gender”. The said publication even includes a section “Multidimensional poverty by caste in India” and yet remains completely silent on Nepal on that score since we chose not to conduct such an analysis.
The future of quotas
In a recent article summarising his impressions after six months of travelling the length of the Nepali mid-hills, political scientist Krishna Khanal noted the groundswell of opinion against both provinces and proportional representation. He cautions, however, that those views were expressed almost invariably by the Khas-Arya, and that rarely did he hear similar sentiments from women, Dalits, Madhesis or Janajatis.
Anyone who has their antenna up knows that is equally true for the issue of affirmative action and its manifestation in Nepal—fixed quotas in elections, government service and education. We also know that quotas were introduced as part of the state restructuring process to bring all the marginalised groups into the mainstream. Yet, a powerful constituency has consistently railed against it, including by questioning the calibre of those who are able to succeed in part due to the quota system (and that is a subject that requires a separate treatment altogether).
One argument made is the need to be aware of regional disparities. Given how often it has been wielded, it can be termed “The Bahun from Karnali” thesis, which basically questions why, for example, a relatively better-off Dalit man from Jhapa should be allowed to take advantage of positive discrimination while a much poorer Bahun boy from Jumla should be deprived of the same. The fact that the quota system is also meant to make the state more representative of all the citizens aside, there is some merit to the argument. What it fails to recognise, though, is the entrenched intra-regional disparity. Thus, an earlier application of the MPI method in Nepal, analysing the NLSS 2003-04 data to look at the level of exclusion/inclusion of various caste and ethnic groups, describes the not-surprising finding that “although Brahmin households in the Western Hills/Mountains…are more excluded than Dalit Kami households in the Eastern Tarai, relative to a Kami household within the Western Hill/Mountain region…a Brahmin household in that region is almost twice as included”.
We do not know how much the situation has changed over time since the nodal body responsible, the NPC, has chosen to ignore the matter and allowed innuendo and imprecise and incomplete information to flourish. But if we are to get rid of quotas and the like—and that is surely a desirable goal—we need the data to tell us if the time has come or not. Just ‘believing’ or ‘claiming’ that to be the case without any basis in facts will be a sure recipe for disaster on all fronts.


 18.12°C Kathmandu