 21.01°C Kathmandu

Wed, Jul 15, 2026
Opinion
How Nepal has voted
Fair competition enables members of the janajati populace to rise to leadership positions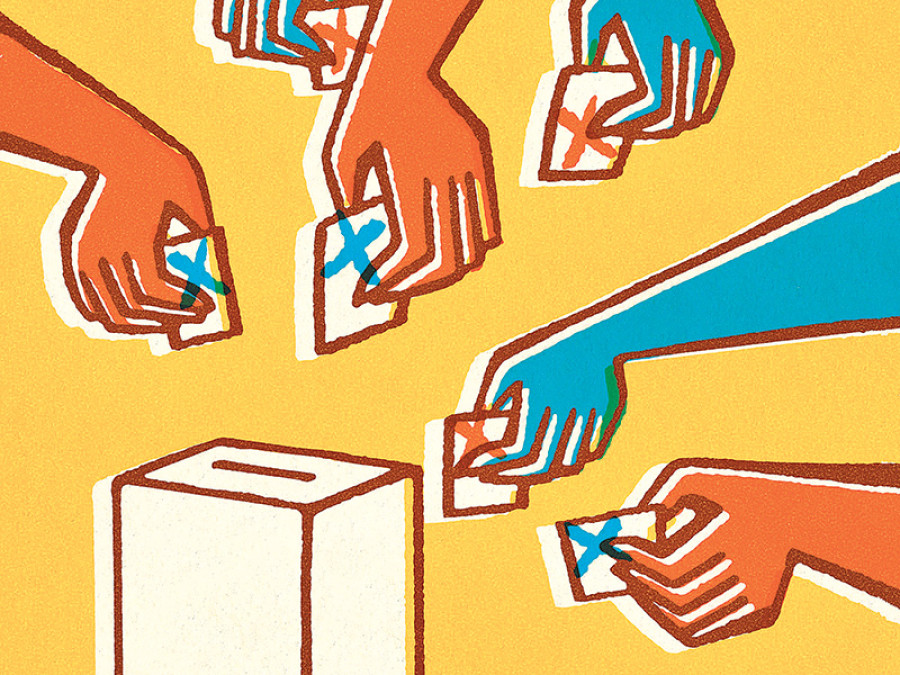
bookmark
Krishna Prasad Sharma & Krishna Prasad Upadhyaya
Published at : September 14, 2017
Updated at : September 14, 2017 08:20
Nepal recently held elections for the powerful local bodies in six out of seven provinces. The elections to the local bodies in Province 2 are slated for September 18, 2017.
Under the new constitution, there are 753 local bodies, including Metropolitan and Sub-Metropolitan cities, and Urban and Rural Municipalities. A total of 14,058,240 voters vote for mayors/deputy mayors of these metropolitan/sub-metropolitan cities, and chairs/vice-chairs of urban and rural municipalities.
Comprehensive breakdown
The constitution reserves 13,388 seats for women, out of which 6,684 are for Dalit women. Thus the implementation of the constitutional provision itself ensures 40 percent representation of women in local governments. In addition to that, under the constitutional provisions, half of the top positions, i.e. 753 positions, will be contested by women.
However, the constitution does not reserve seats for the janajati (indigenous ethnic groups) in Nepal. An examination of the local level election results reveals the level of inclusion of ethnic groups in leadership positions of local governments. The Elections Commission of Nepal has released election results from 617 local bodies (out of a total of 753) and 69 districts (out of 77) in provinces 1, 3, 4, 5, 6, and 7. Analysis of these results reveals important insights.
The local election results show that in the six provinces where elections were held, a total of 590 janajati leaders from different parties were elected to the top two leadership positions of the local governments. There were 1,234 top two positions (Mayor, Deputy Mayor, Chair, vice-Chair), thus, 47.73 percent of the top positions were held by janajati leaders nationally.
At the provincial level, the result shows some variation, but in four provinces, the percentage of top positions held by janajati leaders is higher than the national percentage. For example, 193 janajati leaders were elected for top two positions out of a total of 274 top two positions in Province 1. This comes to 70.43 percent of the total top positions. Province 3 had a total of 238 top two positions, out of which 127 positions were secured by janajati leaders, amounting to a 53.36 percent representation. In Province 4, 5, 6 and 7 janajati representation in the top two positions stands at 55.88 percent (95/170), 50 percent (109/218), 23.41 percent (38/158) and 15.90 percent (28/176) respectively. Province 6 and 7 have low concentrations of janajati population, with almost no such ethnic groups in the far-western hills.
Janajati representation at the district level is more encouraging. In Province 1, the janajati representation in top two positions in areas with a high concentration of janajati population like Bhojpur, Pachthar, Udaipur, and Taplejung stand at 88.89 percent, 87.5 percent, 87.5 percent, and 77.77 percent respectively. Even in Jhapa district where non-janajati population is in the majority, the janajati representation in the top two positions is 46.66 percent.
Similar trends can be seen in other provinces. In Province 3, janajati representation in top two leadership positions is highest in Makwanpur district (80 percent), followed by Rasuwa (70 percent), Sindhuli and Lalitpur (66.66 percent). Chitwan (40 percent) and Dhadhing (34 percent) have the lowest janajati representation. In Province 4, trends of higher representation can also be seen in districts like Manang (87 percent), Tanahu (75 percent), Syanja (36 percent), Lamjung (42 percent), and Myagdi, Gorkha, Nawalparasi and Kaski (50 percent each). In Province 5, Rukum and Bardia have a 66.66 percent and 68 percent rate of janajati representation.
Promising statistics
Nationally, UML has 45.42 percent share of the total janajati representatives elected in the top two positions of these provinces. The share of the Nepali Congress, Maoist Centre, Madhes-focused parties, and others (including Nayashakti, Rastriya Jana Morcha and Nepal Majdoor Kisan party) stand at 34.74 percent, 14.74 percent, 4.06 percent, and 1.02 percent respectively.
In the six provinces where elections were held, a total of 290 janajati women (as against 300 janajati men) were elected in top positions, mainly in deputy mayoral positions and/or vice-chair. This amounts to 23.50 percent of the total 1,234 top two positions. Among the janajati leaders in top two positions, the share of janajati women leaders elected to the top positions is 49.15 percent. It should also be noted that women were elected due to the constitutional provision that one of the contestants for top two positions must be a woman for all parties. Obviously, janajati women contesting for these positions were from areas with high ethnic concentration.
The results indicate three important points. Firstly, fair competition and following of constitutional provisions enables members of the janajati populace to rise to leadership positions. This shows that, irrespective of the parties, leaders of ethnic communities get elected from areas with high janajati concentration. This indicates that implementing the new constitution will change the composition of the local governments.
Secondly, holding a high percentage of top-two political positions of the powerful and resourceful local governments also increases their power base to influence the results of provincial and federal elections, and further increase the representation of janajatis in the provincial assembly and federal parliament.
Thirdly, there is a bigger possibility of being elected while contesting on behalf of national parties, as members of non-ethnic groups are more likely to vote for them under this condition. The results also show the diminishing role of ethnic parties in election frays, though they remain important advocates to pressurise the national political parties and politics.
Upadhyaya is a London-based human rights professional and researcher; Sharma is a London-based social activist

.PNG&w=200&height=120)

.png&w=200&height=120)

Editor's Picks
Proposed ‘Romeo and Juliet’ law may spare boys, but what about girls?

Three prime ministers, 10 premierships. Why is Sudurpaschim still Nepal’s poorest province?

Inside the strange, disciplined, unreachable world of Nepal’s Prime Minister

Three credit booms in three decades ended in economic downturn

How Nepal could lose a generation of footballers due to FIFA’s suspension
E-PAPER | July 15, 2026
×